| The
olive production industry comprises mainly two industrial sub-sectors
-table olives and olive oil production- that are highly relevant for regional
economic growth and development in Argentina. Both activities share the
same raw material, 60% of which is used for olive oil production, with
the remainder being allocated to table olives. This ratio is a function
of several factors, including the supply of varietals and product prices
in the international marketplace.
A CHANGING SCENARIO
-
Most indicators in this
business have improved in recent years, both for table olives and
for olive oil, thus allowing Argentina to improve its market share
and its positioning as a global producer.
-
Just like a decade ago, the
European Union concentrates world production, with Spain prevailing
over other EU countries.
-
In the Americas, Argentina
ranks as the No. 1 olive producer, though the momentum the sector
(especially olive oil production) has gained in other countries such
as Chile is also worth underscoring.
-
According to interim figures
for the 2007/08 crop year released by the International Olive Oil
Council (IOOC), Argentina will account for 5% of table olive production,
and for 0.9% in the case of olive oil.
-
These figures will position
Argentina in the 7th and 10th place, respectively, in the world’s
olive production ranking.
-
The origins of this crop
in Argentina can be traced back to the Spanish conquest. The sector
went through various upturns and downturns, bur the current expansion
cycle commenced in the ‘90s, with the inflow of capitals alien
to this sector into the existing regional economies.
-
Hence, there were major improvements
in picking technologies, and new varieties were added to produce olive
oil varietals and table olives.
-
Catamarca, La Rioja and San
Juan Provinces –which make up the olive map together with Córdoba,
Mendoza and Buenos Aires– benefited the most from this economic
development. Today, expansion projects are also under way in the Provinces
of Rio Negro and San Luis, among other regions.
-
In this scenario, it is necessary
to draw attention to the differences between existing or traditional
production and the new forms that have emerged in recent years.
-
Modern plantations are characterized
by a high density, and they are subject to more sophisticated management
techniques.
-
The addition of new technologies
resulted, among other things, in an increase in estimated mean yields
from 5-6 tons /hectare to 10-12 tons / hectare (1 hectare= 2.4710
acres).
-
Several public and private
institutions work today within the scope of the Foro Nacional Olivalero
(Argentine Olive Production Forum) to encourage the streamlining of
traditional sectors with a view to meeting current market demand by
restructuring this segment to provide high value-added products and
diversifying production to meet premium quality market niches.
-
The results of this transformation
effort will become apparent in the next few years, with the ensuing
spillover effect in each region involved.
-
As to production volumes,
new plantations began to bear fruit in the early years of this decade.
-
Argentina reached a record
high in olive oil and table olive production in the 2007 crop season
with some 25,000 tons and 95,000 tons, respectively, and similar values
are forecast for the 2008 campaign, in view of some problems generated
by adverse weather conditions.
-
These figures are expected
to double in the next decade.
FOREIGN TRADE
Exports
|
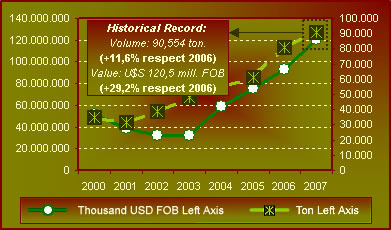
| Evolution
in Table Olive Exports 2007 - 2008 |
| |
|
..Source: National
Food Administration based on provisional data
..from
Customs.
|
|
-
Table olive exports totaled
90,554 tons in 2007, with foreign currency revenues of USD 120.5 million
FOB.
-
This constitutes a 29.2%
increase in value terms and an 11.6% rise by volume vis-à-vis
2006.
-
The general average price,
with a 15.7% increase, shows the same trend.
-
These figures confirm the
continued upward trend for this product in recent years.
-
Transactions in the first
year of the series under review (2000) totaled 34,666 tons with revenues
of USD 51.2 million FOB. Cumulative variations (2007 vs. 2000) amount
to 135.5% in value terms and 161.2% by volume.
|
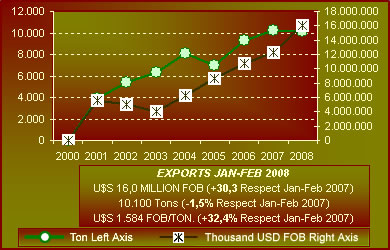
| Evolution
in Table Olive Exports in First 2 Month Periods Trimester 2000-
2008 |
| |
|
..Source: National
Food Administration based on provisional data
..from
Customs.
|
Source: National Food Administration
based on provisional data rom Customs. |
-
The lowest volume was recorded
in 2001 (31,844 tons), whereas the floor in terms of value was reached
in 2002 (USD 32.2 million FOB).
-
Table olives in brine account
for 87.1% in value terms and 85.2% by volume of all exports, i.e.
a 19.6% and 2.9% growth, respectively, as against figures for 2006.
-
Moreover, the general average
price of table olives in brine showed a 16.2% increase in 2007 vis-à-vis
2006 (USD 1,361 FOB vs. USD 1,171 FOB).
-
Of total exports during 2007,
12.4% by volume and 20.9% by value correspond to fractioned products.
These went down 1.2% by volume and 1.8% in value terms as against
the preceding period.
-
The general average price
for these products went up by 16.8% as compared to 2006, to a total
of USD 2,236 FOB/ton.
Table 1 - Table
Olives Exports
| |
2006 |
2007 |
Variation
2007 vs 2006 |
| |
US$ FOB |
Tons |
US$ FOB |
Tons |
Value |
Volume |
|
Table Olives in Brine |
87.791.462 |
74.958 |
104.986.316 |
77.115 |
19,9% |
2,9% |
| Others |
5.463.739 |
6.159 |
15.4196.065 |
13.439 |
183,6% |
118,5% |
| Total |
93.255.202 |
81.109 |
120.482.381 |
90.554 |
29,2% |
11,6% |
..Source: National
Food Administration based on data of Customs.
|
-
Table olives sold in bulk
increased their market share, both in volume and value terms, as they
accounted for 87.6% and 79.1%, respectively, of total exports.
-
In 2007, the general average
price was USD 1,203 FOB/ton, i.e., a 16.9% above 2006 average prices.
-
Exports were shipped to 32
destinations in 2007. Brazil ranked first, with 53,188 tons and USD
63.7 million FOB, thus continuing with the current trend.
-
The USA ranked second, with
22,319 tons (and revenues of USD 35.2 million FOB). This market accounts
for 29.2% in value terms and 24.6% by volume, and shows an increase
as against 2006.
-
Shipments to Spain went down
from 19.8% in value terms and 16.5% by volume in 2006 to 2.7% and
3.1%, respectively, in 2007.
-
In the first two months of
2008, exports totaled 10,100 tons, with revenues of USD 16.0 million
FOB, i.e. a general average price of USD 1,584 FOB/ton.
-
Compared to the same period
of 2007, these figures show a 30.3% increase in value terms, a 32.4%
rise in the average price and a 1.5% decrease in the transacted volume.
-
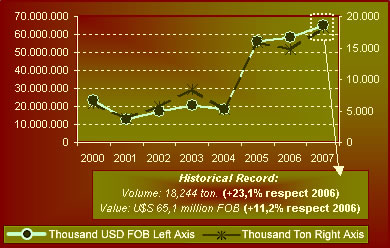
In turn, olive oil exports
reached a new historic record, as they grew by 23.1% by volume and
by 11.2% in value terms as compared to 2006. The export volume amounted
to 18,244 tons, with revenues of USD 65.1 million FOB.
-
This represents a 192.7%
and 181.2% increase by volume and by value, respectively, from the
sales recorded in 2000.
-
Virgin olive oil accounted
for the largest share of transactions: 91.7% by volume and 91.4% of
total export value, (+25.6% and +12.9%, respectively, vis-à-vis
2006).
-
Fractioned products accounted
for 28.8% by volume and 37.9% in value terms of total exports.
|
|
| Evolution
in Olive Oil Exports 2000 - 2007 |
| |
|
..Source: National
Food Administration based on provisional data
..from
Customs.
|
|
-
Exports grew 2.2 percentage
points in value terms, but volumes went down by an identical percentage
as compared to the preceding period.
-
The general average price
went up by 3.2% from 2006 levels, to a total of USD 4,694 FOB per
ton.
-
The market share of olive
oil sold in bulk grew by 2.2% by volume, but it went down by an identical
percentage in value terms as against 2006.
-
The general average price
was USD 3,113 FOB/ton, down by 15.4% vis-à-vis 2006.
-
Olive oil was exported to
39 countries, with the USA being the No. 1 importer –both in
terms of volume and value–, thus maintaining the trend noted
in 2006 (it accounted for 44.4% by value and 50.0% by volume of exports).
-
Brazil ranked second, with
41.7% in value terms and 35.5% by volume.
Table 2 - Olive
Oil Exports
| |
2006 |
2007 |
Variation
2007 vs 2006 |
| |
US$ FOB |
Tons |
US$
FOB |
Tons |
Value |
Volume |
| Virgin Olive Oil |
52.725.307 |
13.316 |
59.511.869 |
16.723 |
12,9% |
25,6% |
| Olive Oil |
486.238 |
121 |
269.365 |
68 |
-44,6% |
-43,8% |
Refined
Olive Oil |
5.329.776 |
1.387 |
5.313.678 |
1.453 |
0,3% |
4,7% |
| Total |
58.541.365 |
14.825 |
65.094.912 |
18.244 |
29,2% |
11,6% |
..Source: National
Food Administration based on data of Customs.
|
-
Spain went down from the
3rd to the 9th place, given that both in terms of volume and value
its share dropped from 8.0% and 8.3% to 0.7% and 0.6%, respectively.
-
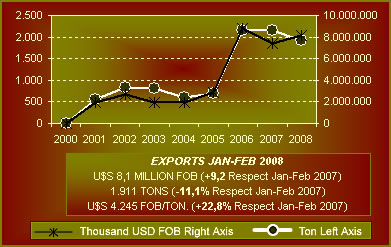
Olive oil exports totaled
1,910 tons in the first two months of 2008, with revenues of USD 8.1
million FOB.
|
| Evolution
in Olive Oil Exports in First 2 Month
Periods Trimester 2000 - 2008 |
| |
|
..Source: National
Food Administration based on provisional data
..from
Customs.
|
|
-
The general average price
was USD 4,245 FOB/ton this month.
-
These figures evidence an
average improvement of 9.2% by value and a 22.8% rise in the average
price, and an 11.1% reduction in the transacted volume compared to
the same period of 2006.
Imports
-
Table olive imports in 2007
amounted to 28 tons with a value of USD 115,890 CIF, i.e. a +17.8%
variation in value terms and -0.2% by volume as against 2006.
-
Imports came from 9 countries,
mainly Spain, Italy and China, which accounted for 92.9%, 4.0% and
2.6%, respectively.
-
As regards olive oil, the
transacted volume was 294 tons and USD 1.5 million CIF, i.e. +103.8%
and +74.4% by volume and value, respectively, from 2006 figures.
-
Imports came from 13 countries,
the No. 1 source being Tunisia (37.6% of the marketed value), followed
by Spain and Italy (28.2% and 23.9%, respectively).
|