.....Versión en Castellano

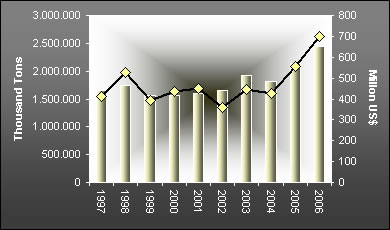
The Argentine sugar sector has shown a remarkable production increase in recent years. However, there was no need of increasing the planted area in a considerable way.

While the whole area corresponding to the producing provinces (Salta, Jujuy and Tucumán) is around 250,000 hectares, the volumes obtained indicate a clear growth.

The graph 1 shows the evolution of sugar production in Argentina in the last 10 years, in volume and in dollars.
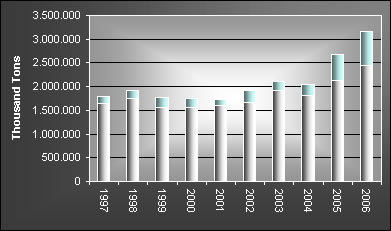
 

Sugar production in volume and value


..Source: National Food Administration on the basis of data of Customs.


  • The production increase and record harvests achieved by this sector are the result of investments in the growing activity and in the industrial processing made in the last ten years.
  • In 2005 production was 2,138,826 tons of crude sugar (17.8% higher than the previous year). In 2006 production of crude sugar increased 14%, reaching 2,438,492 tons.
    As commented in a previous report, investments were directed to:
  • Machinery and installations at sugar mills with equipment that incorporated the most recent technological innovations.
  • Concentration of sugarcane plantations in the most suitable areas and replanting with higher yield species, the most outstanding being the LCP85-384 brought from Louisiana, United States.
  • Incorporation of new generation combine harvesters that in addition to being more efficient can harvest green sugarcane without the traditional previous burning. This caused a remarkable improvement from an ecological viewpoint and placed our country as leader in the use of these systems.
  • Record harvest and production of 2.68 million tons of crude sugar were estimated for the present year (10% higher than the previous year), but a series of problems seem to be hindering this objective. In the first place the lack of gas delayed the beginning of the harvest (only at the start, as the main input used to continue the harvest is the same bagasse). In the second place, rainfall registered reduced the firmness of the land hampering the introduction of combine harvesters into the field. Finally, also important was the negative impact of frost and of low temperatures suffered by the north region that will reduce the sugarcane yields. As a consequence, it is estimated that 2007 production will repeat the figures of 2006.


Production and export
1997 - 2006


..Source: National Food Administration based on data of Customs.


The sugar sector supplies mainly the local market, and is trying to increase exports aiming at achieving higher production levels. The results of these efforts are reflected in the chart 2, that shows the comparative evolution of production and exports in the last decade.

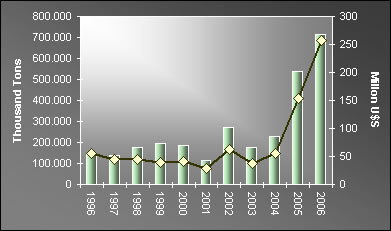
It can be observed that in recent years as production increased, there was a consequent increase in exports. 2006 production (2.4 million tons of crude sugar) was 32% higher than that of 2004 (1.8 million tons of crude sugar), and in the same period exports increased 217.20%.

The graph 3 shows Argentine sugar exports in volume and in dollars for the period 1996-2006.


Sugar exports in volume and in dollars

..
Source: National Food Administration based on data of Customs.


  • Exports from January to April of the current year reached 12,342.5 tons of crude sugar (equivalent to an estimated amount of US$ 3,702,750), and it is anticipated that exports will reach 600,000 tons by the end of the year.
  • Other important parameters registered by this activity are imports and sugar consumption.
    The chart summarizes the global evolution of this sector in the last 10 years.
  • The international scene shows that Brazil (1st world producer) will have an estimated growth of 11.2% in sugarcane production and that this production will be increasingly directed to industrial processing.
  • India (the 2nd world p roducer) is anticipating a dramatic growth of 42% in sugar production compared to the previous year.
  • Russia (main importer of this product) has the objective of increasing productivity precisely to avoid imports and get free from the fluctuation of international prices.

These factors are to be added to the fact that in the world there are 9 million tons exceeding world demand. The result of this is a fall in the international price that is usually referred to the London Contract Nr. 5 for white sugar. The quotation reached its peak of US$ 500 in 2006. At the moment, it is around US$ 309, and in spite of having decreased it continues to be a very good price.


Year Production Import Export Consumption
  Ton1 Ton1 Ton1 Ton2
.1997 1.649.140 63.401 139.732 1.469.915
.1998 1.749.184 393 178.106 1.468.664
.1999 1.568.156 1.456 195.894 1.283.858
.2000 1.557.703 1.583 184.482 1.284.864
.2001 1.607.423 1.367 114.600 1.396.439
.2002 1.655.616 972 271.024 1.294.920
.2003 1.924.779 402 177.314 1.585.655
.2004 1.815.845 7.384 229.056 1.489.881
.2005 2.138.826 2.826 535.780 1.500.815
.2006 2.438.492 2.983 714.264 1.614.216


.
Source: National Food Administration based on information from C.A.R.T. and INDEC.
.1 Crude sugar.
.2 Apparent consumption of white sugar.